Out-Fits
Redefining How Students Connect Through Style
A product design tool inspired by academic insights into CMU students' outfits, merging data visualization with personalized stylist experiences.
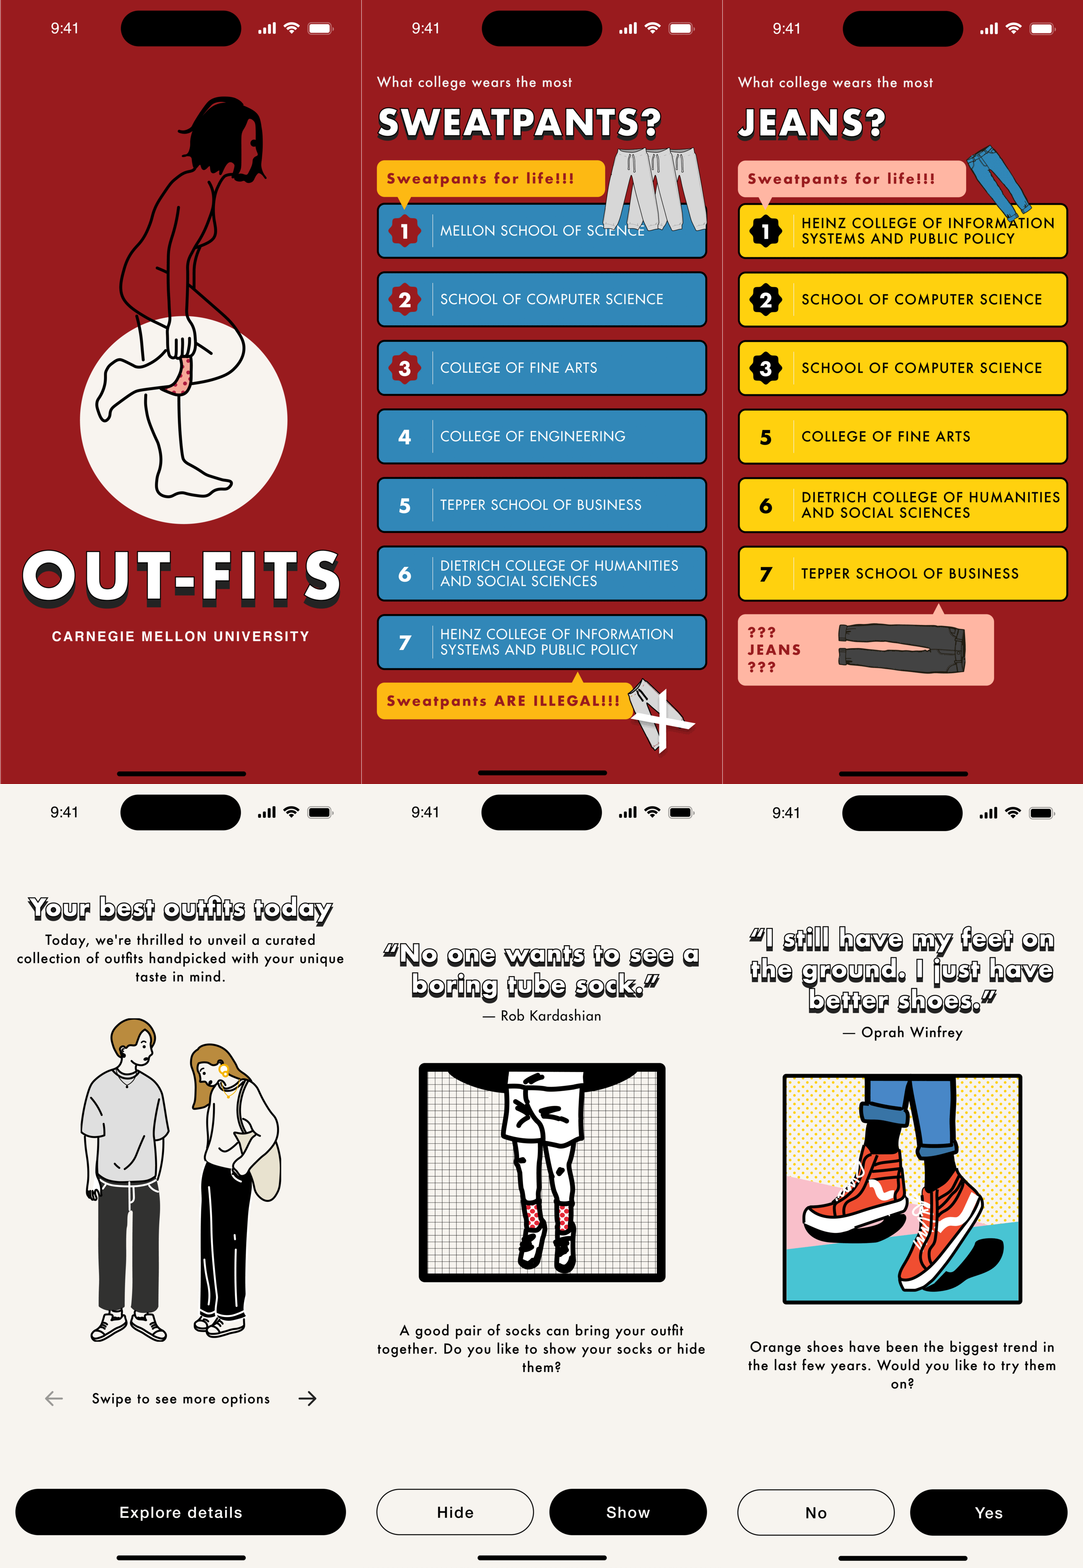
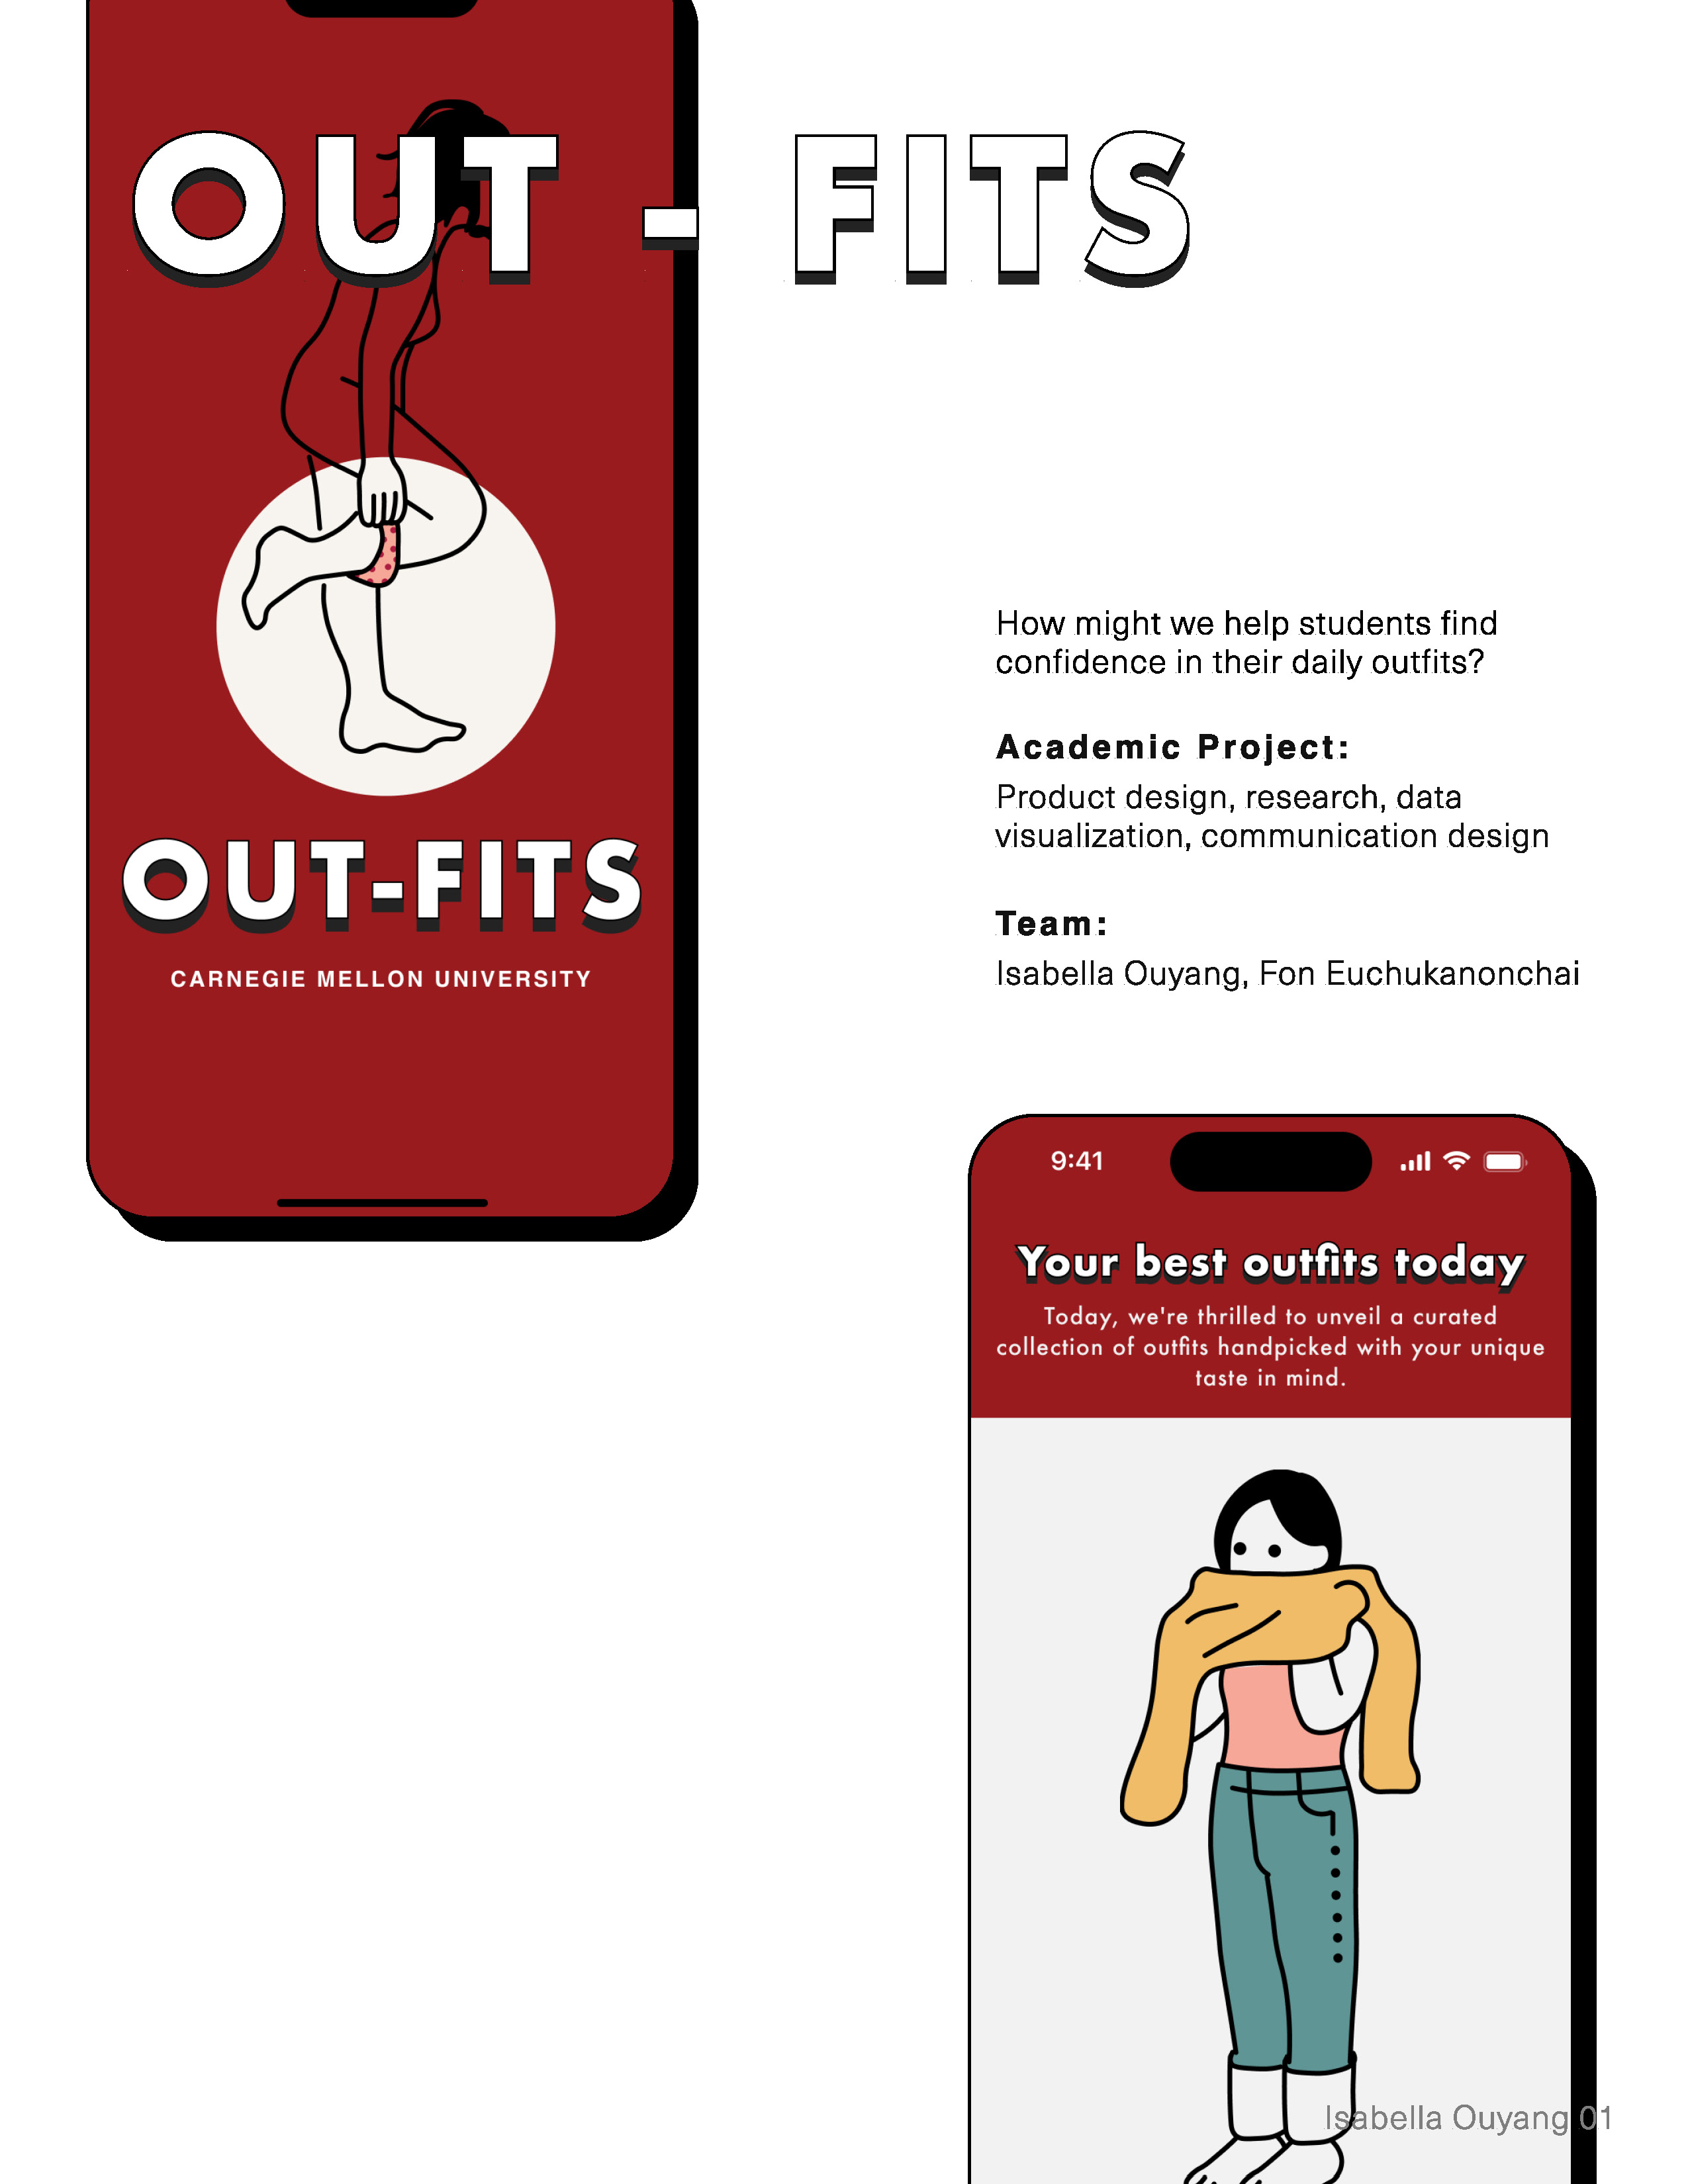
Redefining How Students Connect Through Style
A product design tool inspired by academic insights into CMU students' outfits, merging data visualization with personalized stylist experiences.

Type: Solo iteration on a paired academic project
Role: Product Designer & Manager
Timeline: 1 month (2019, 2023)
Tools Used: Figma, User Survey, Tableau, Excel, Data visualization, Adobe Illustrator, Iterations, Publication, Feedback Collection
Objective: To empower students to find confidence in their daily outfits by creating a platform that blends psychological insights, peer style trends, and personalized recommendations.
Problem Statement: Architectural students wear black; engineers wear shirts. These stereotypes influence our perception of individuals and foster an innate desire for connection and belonging. The challenge was to address the deeper psychological needs behind students’ outfit choices and streamline their daily decision-making process.
Key Insight: Inspired by my academic research on the relationship between students’ academic majors and their outfit choices, I realized the potential to evolve the original Out-Fits concept into a more interactive and data-driven product.
Today's students are under immense pressure to balance academics, social expectations, and personal expression. Clothing is a key part of self-identity and social belonging, yet many students struggle with:
Decision Fatigue: Spending excessive time choosing outfits daily, reducing their focus on academics and other priorities.
Stereotypes and Peer Pressure: Navigating style norms influenced by their academic environment, leading to a lack of confidence in personal choices.
Lack of Tools: Few existing tools address the intersection of personalization, peer trends, and decision efficiency for outfit selection.
Out-Fits addresses this gap by combining data insights and interactive features to help students make confident style choices effortlessly.
Out-Fits empowers students to:
Streamline Decision-Making: By curating personalized outfit recommendations, it reduces decision fatigue and saves time.
Foster Confidence: Visualize peer trends and explore styles that align with their preferences to feel confident and connected in their academic environment.
Encourage Self-Expression: Through avatars and style boards, users can experiment with looks that reflect their individuality while staying in tune with group norms.
Build Community: Out-Fits transforms personal style into a shared, data-driven experience that celebrates diversity and promotes belonging.
Our primary users are College and University Students, ages 18-25, navigating academic and social environments.
They are interested in balancing individuality with peer trends, looking for simple, intuitive solutions to save time on daily outfit choices.
Our secondary users are Fashion Enthusiasts in Academia such as students or clubs focused on trends, self-expression, and group identity.
They are early adopters who can promote Out-Fits through word-of-mouth within their campuses.
Initial Iteration:
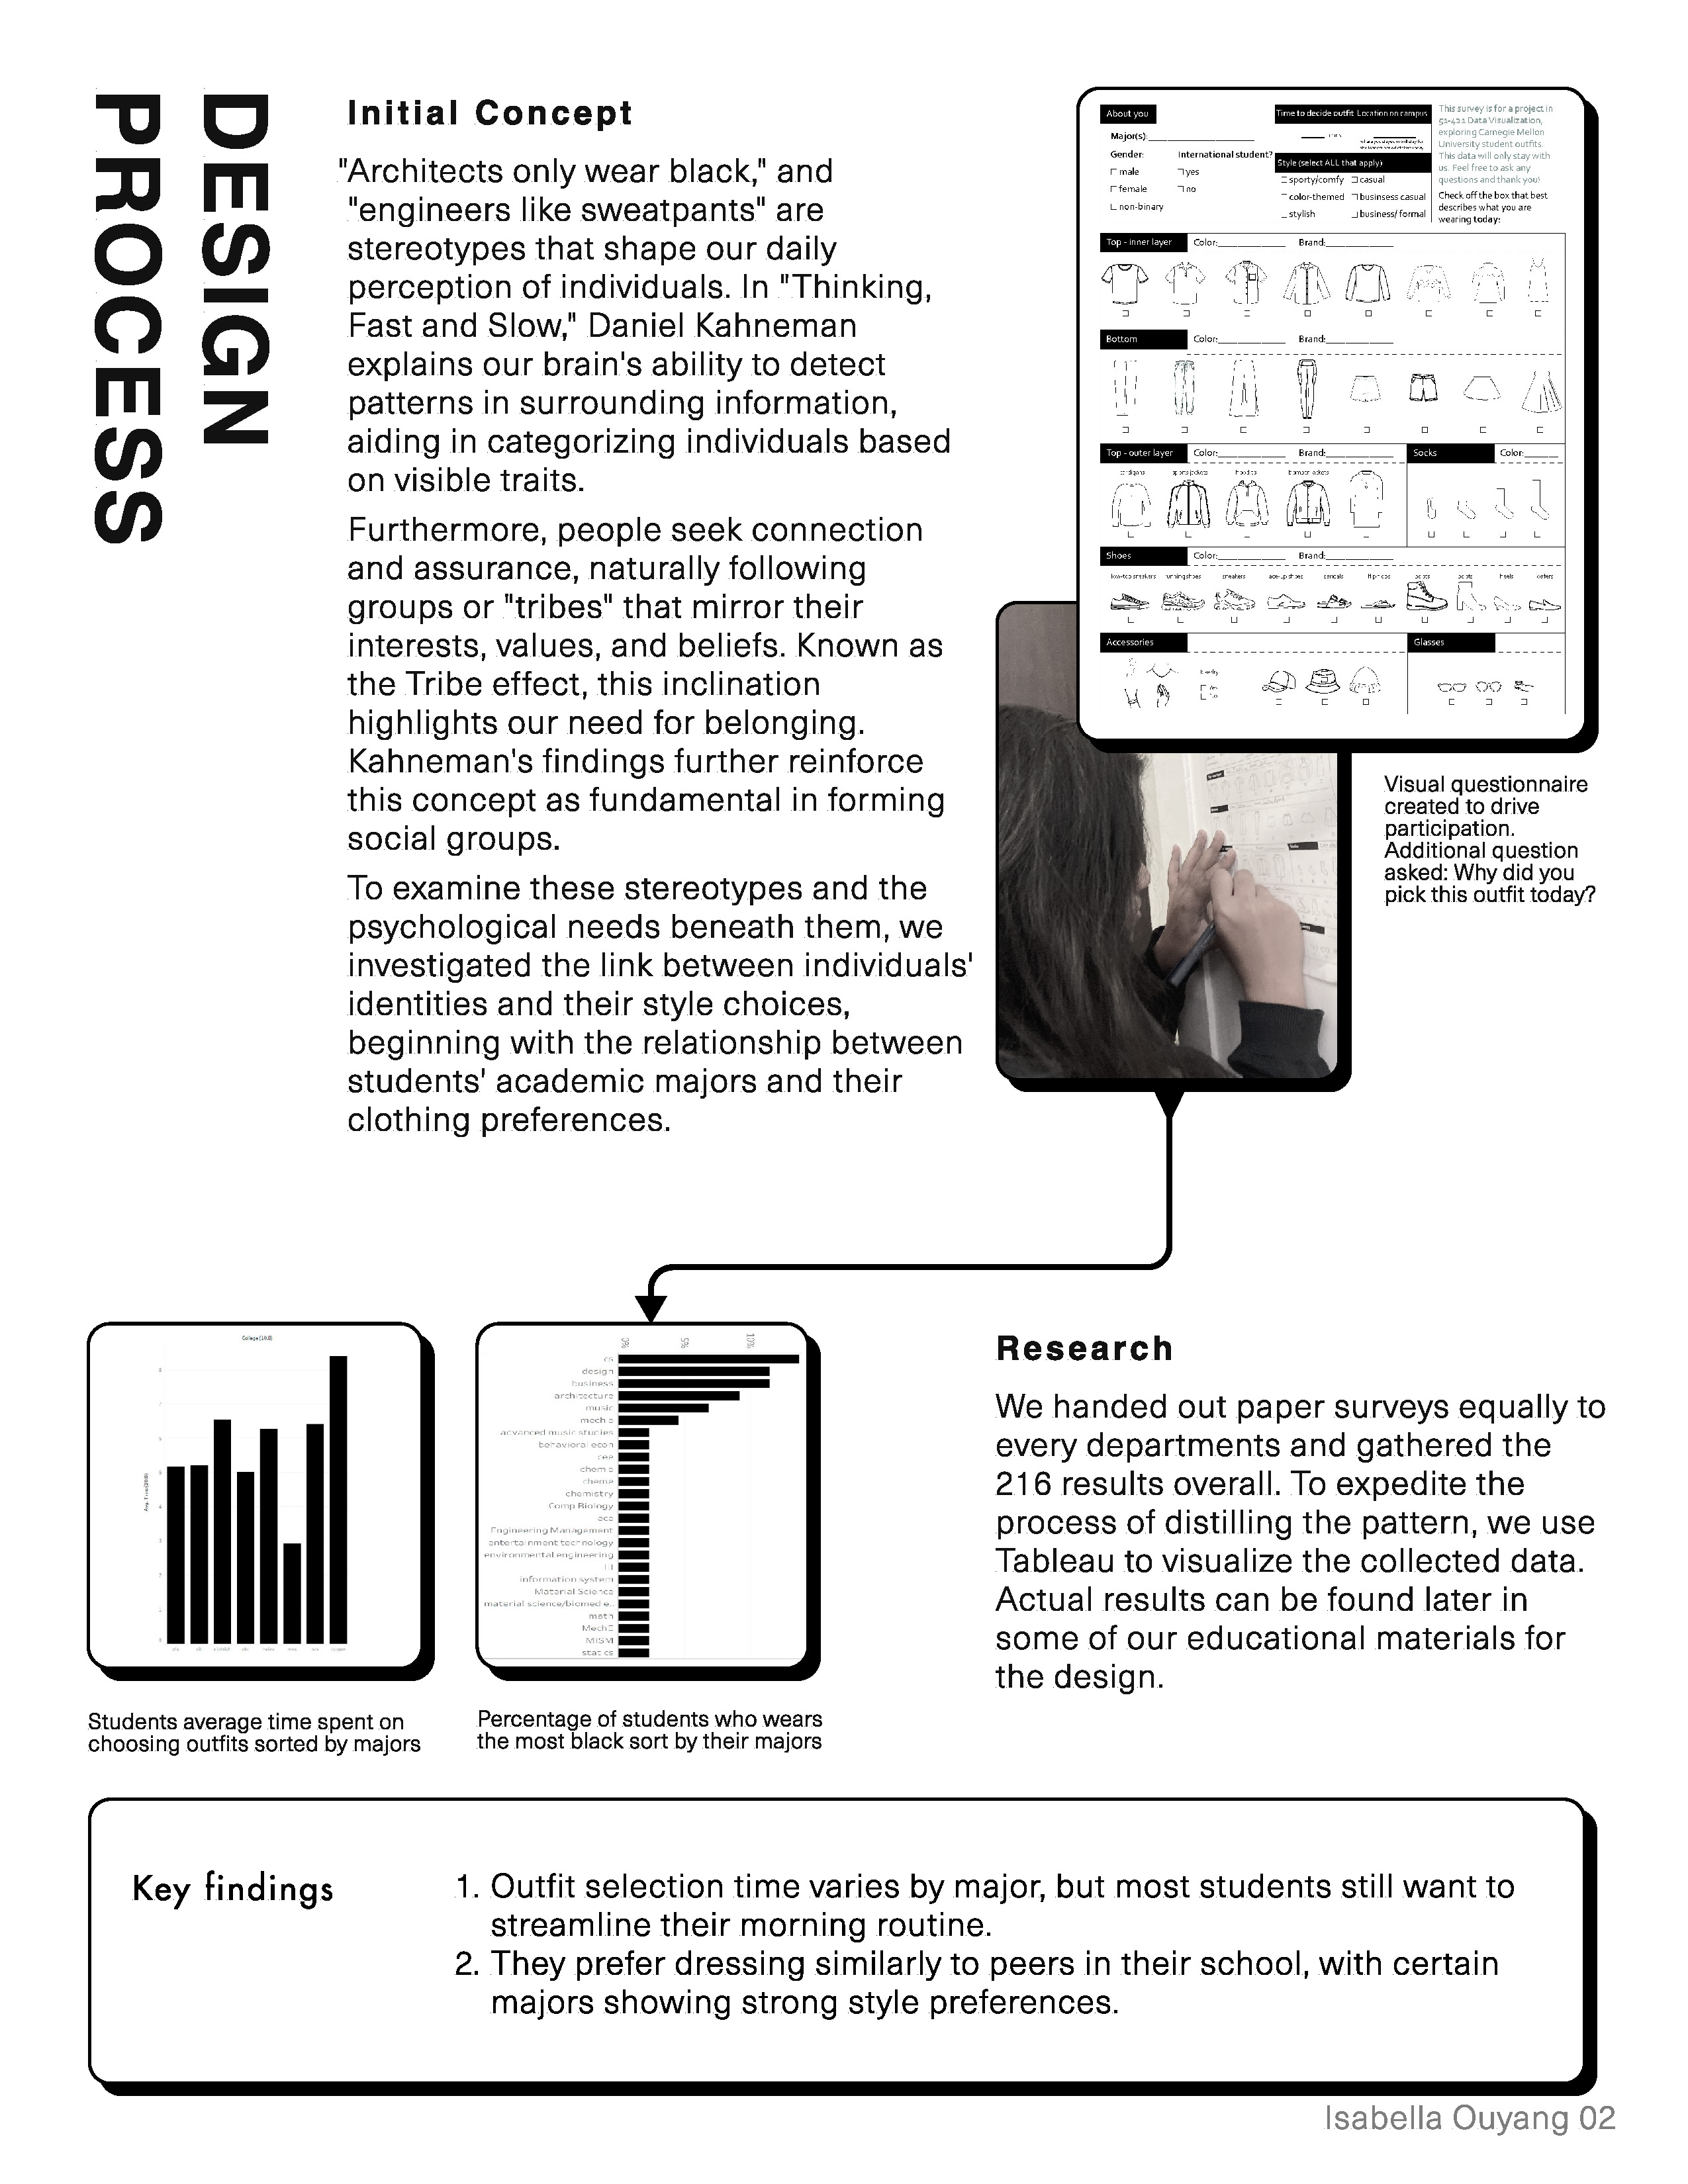
Created during an academic project, the first version of Out-Fits used Tableau-based data visualizations to explore trends in outfit selection among CMU students.
Surveys revealed that students value simplicity in morning routines and prefer dressing similarly to their peers.
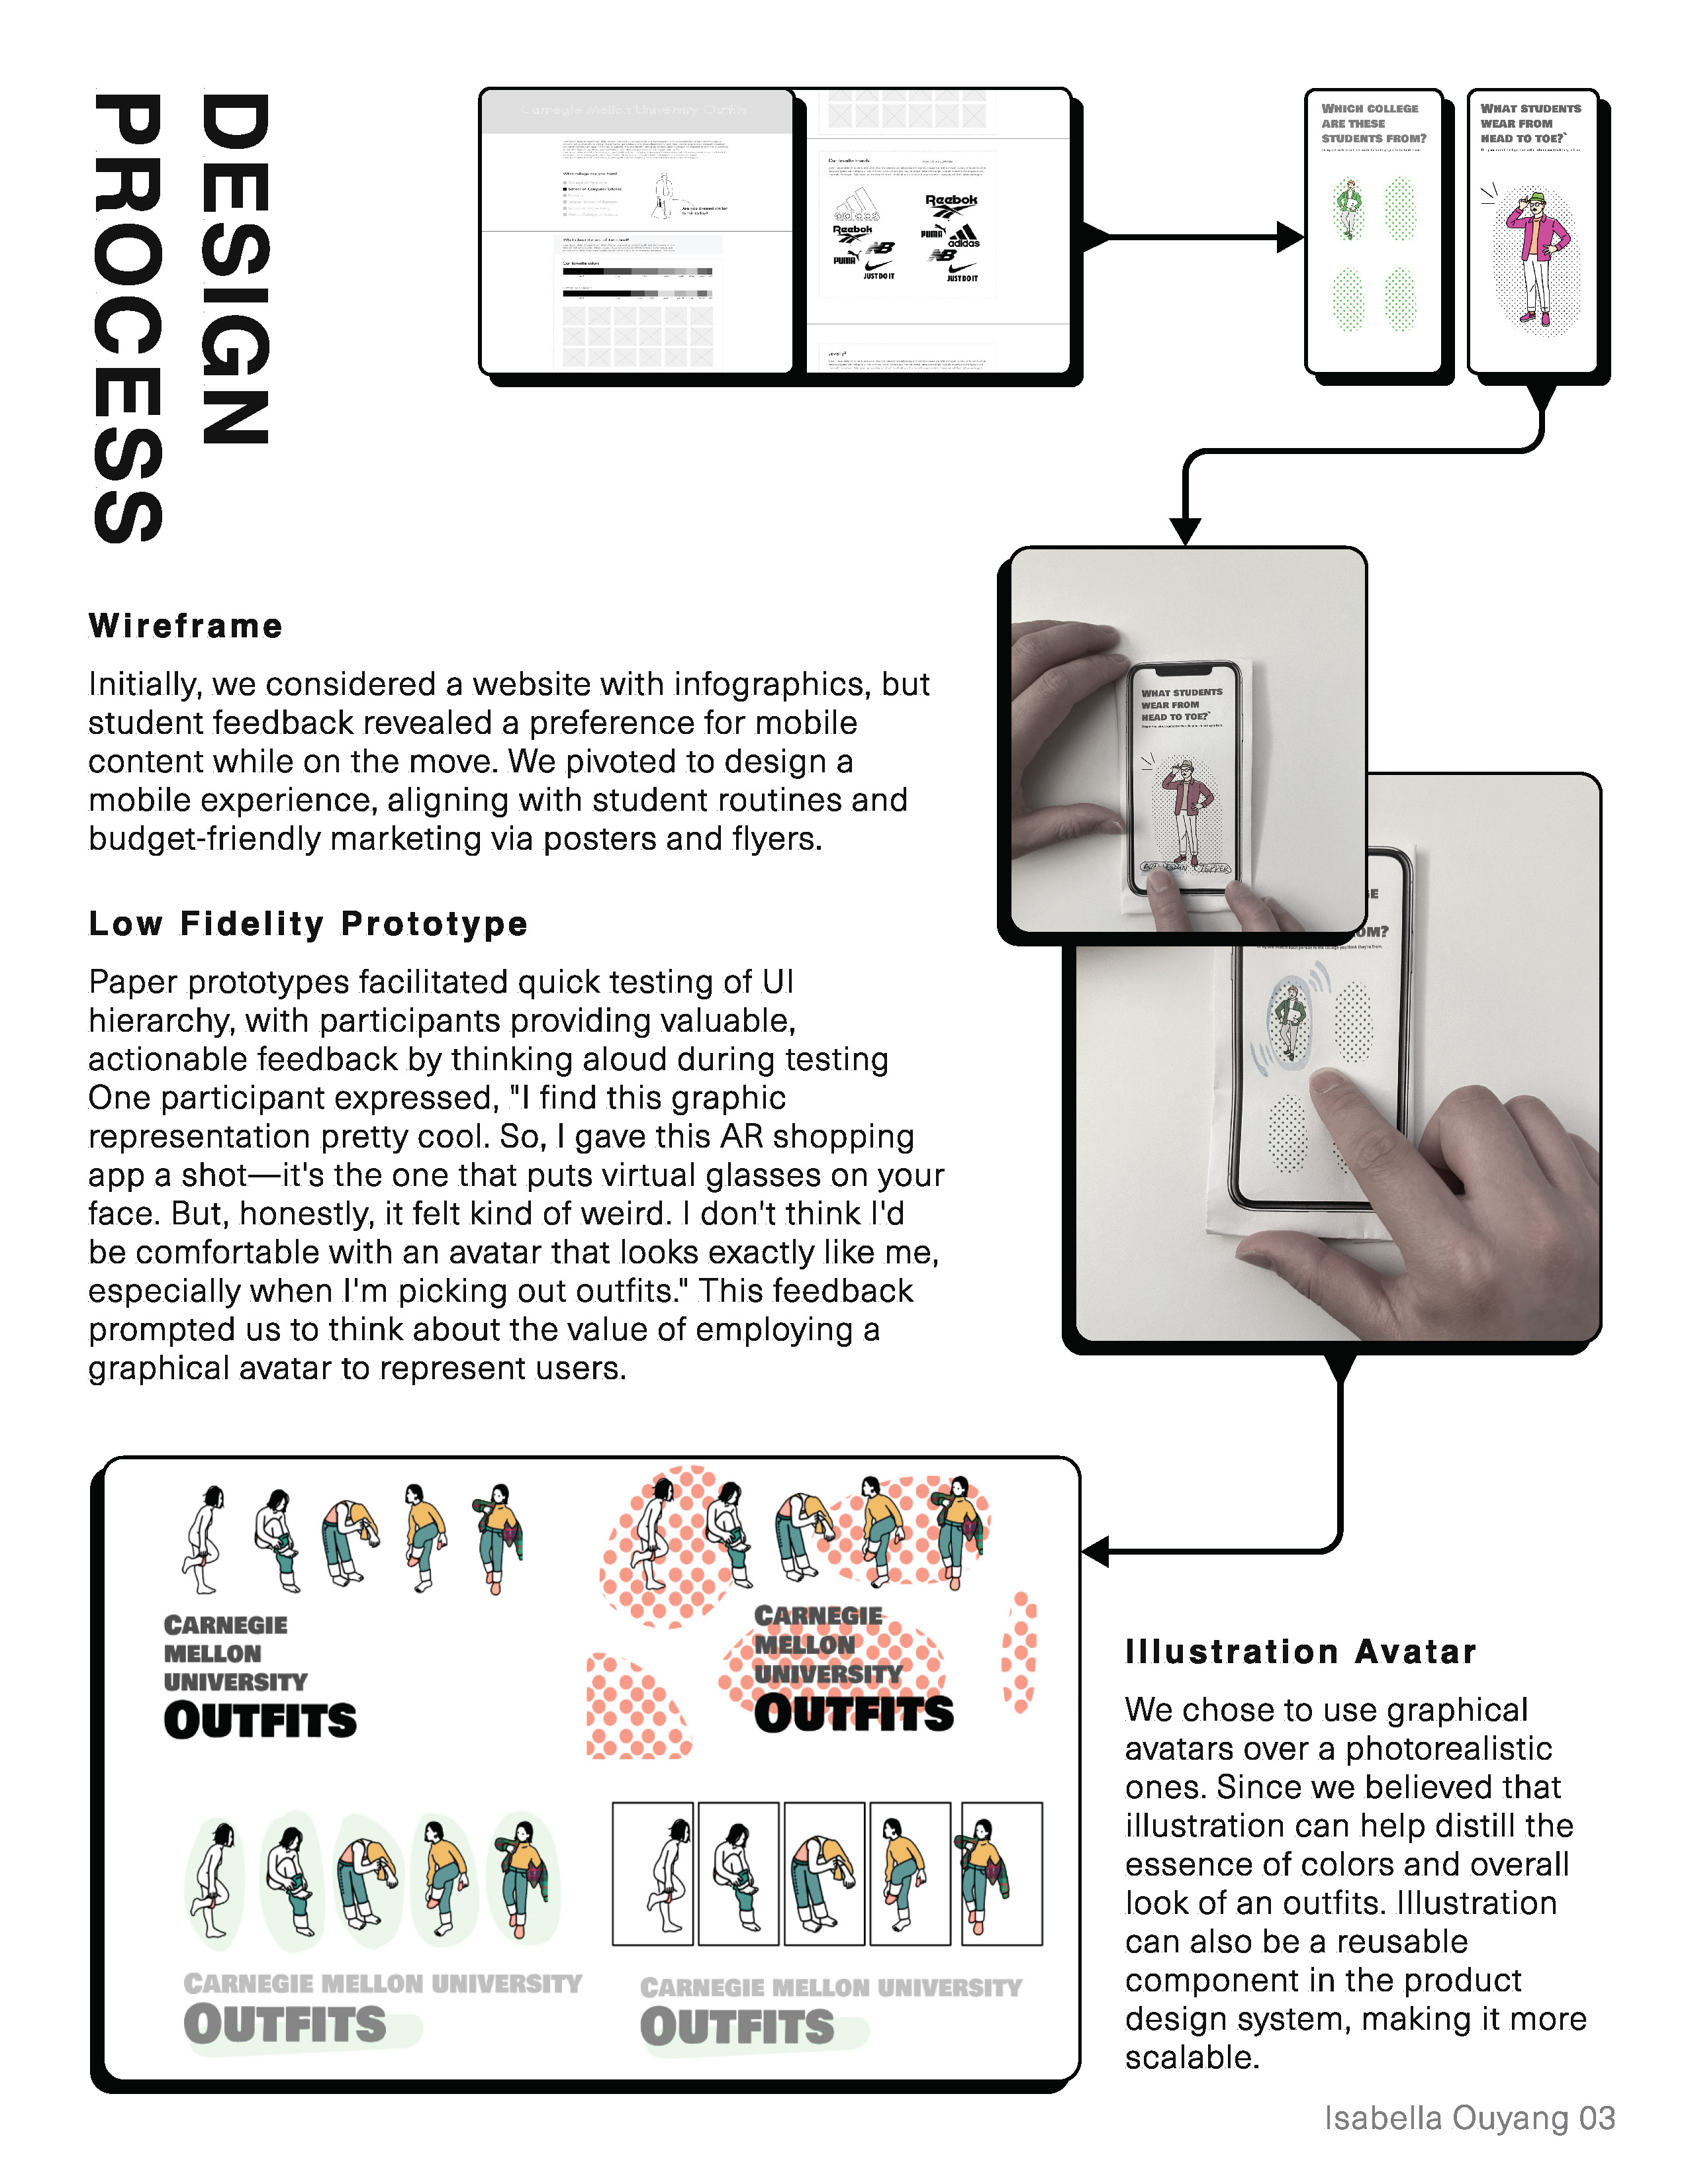
Feedback indicated a demand for mobile-first solutions that integrated outfit recommendations with peer style trends.
Decision to Redesign
While the initial version provided valuable insights, its static data visualizations lacked interactivity. Inspired by data storytelling and the scalability of personalized product experiences, I redesigned Out-Fits into a dynamic, user-centric mobile application.
Data Visualization Final Product: The website was hard coded on mobile screen with the consideration of students' habits.
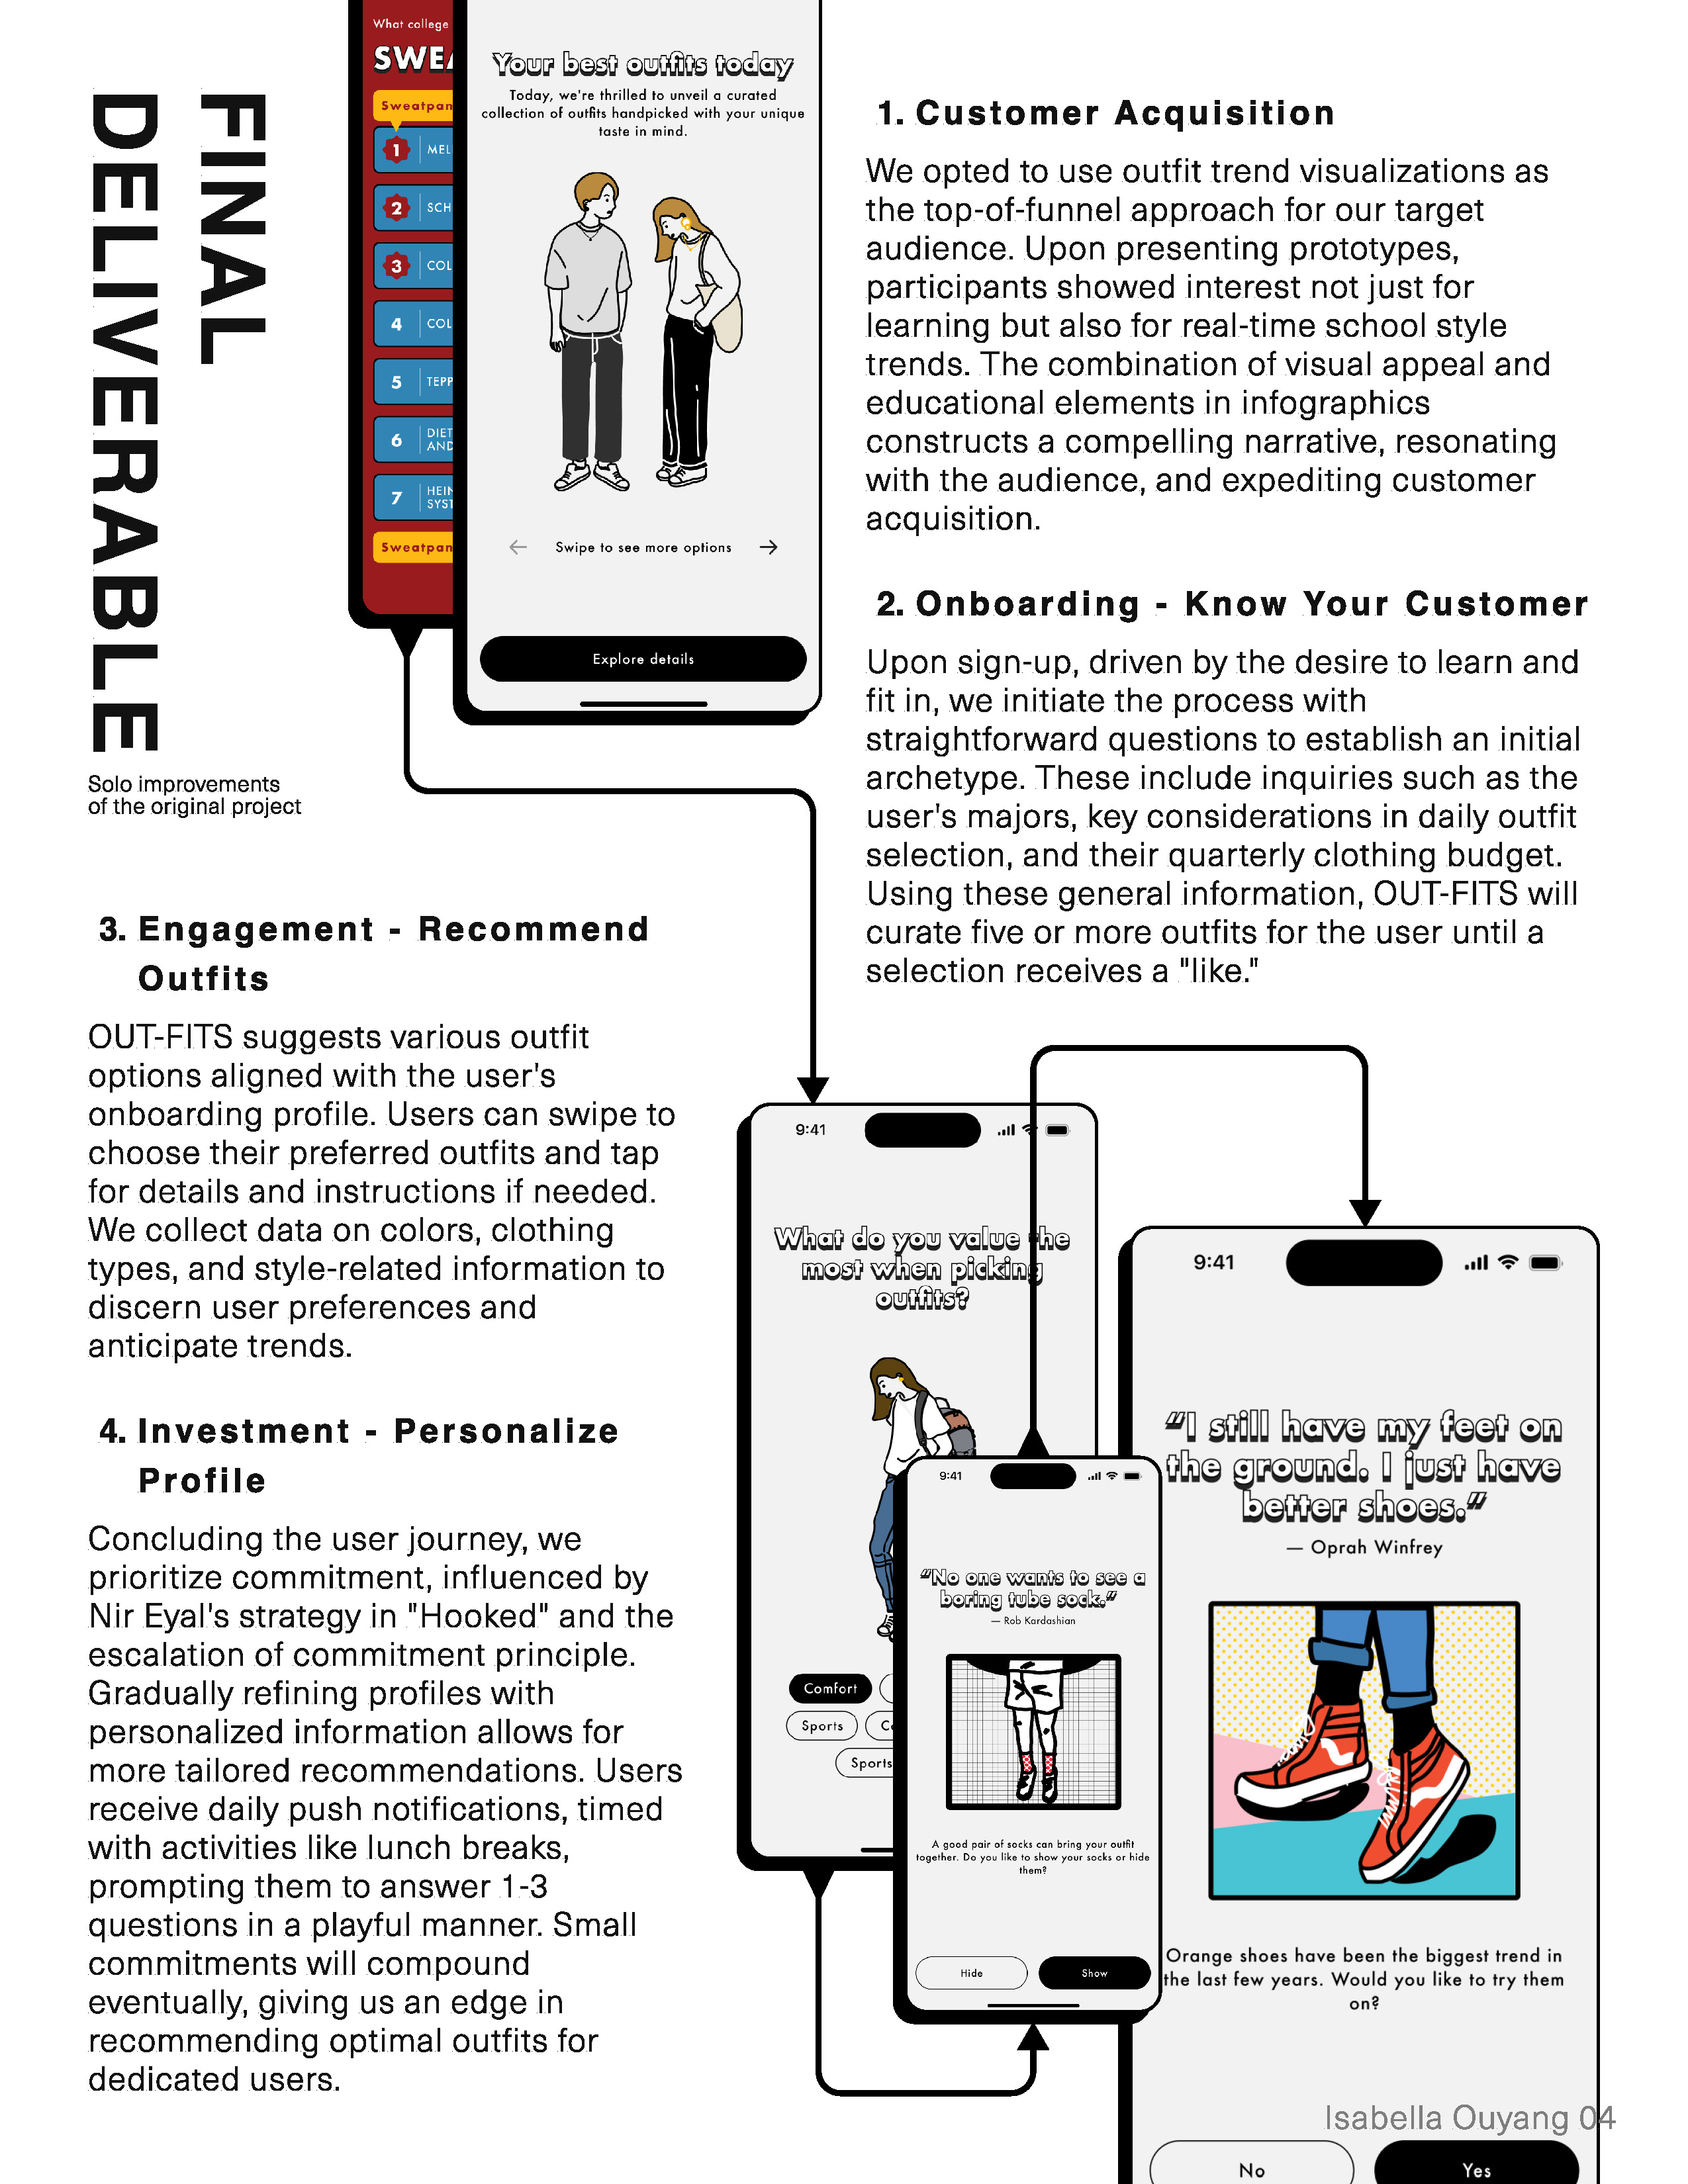
1. Engagement and Scalability
Challenge: It would be hard to find the balance between personal engagement and scalable content.
Solution: By incorporating generalized archetypes and visual infographics, we could ensure each user would feel represented while minimizing the need for excessive customization.
2. User Retention
Challenge: It might be challenging to maintain and increase user retention in a style-based app.
Solution: Implemented Nir Eyal’s "Hooked" framework, gradually personalizing profiles and rewarding small commitments with tailored notifications.
1. User Engagement:
Monitor interaction rates with the swiping mechanism compared to static options, targeting at least a 2x increase in engagement.
Track the time users spend on the app and the frequency of returning users to measure sustained interest.
2. User Confidence:
Conduct surveys to assess users' confidence in their outfit choices before and after using Out-Fits, aiming for at least 85% of users reporting improved confidence.
3. Scalability and Efficiency:
Measure the impact of the illustrated avatar system and modular design on development time for new features, aiming to reduce iteration cycles by at least 30%.
Track the ease of adapting the system for diverse user demographics and expanding style archetypes.
4. Retention and User Growth:
Track retention rates over time, with a goal of achieving a 60% monthly active user rate.
Monitor user acquisition metrics to evaluate the app’s ability to scale within new academic institutions and communities.
Data-Driven Decisions: Transforming academic findings into actionable product features demonstrated my ability to derive meaningful insights from data visualization.
User-Centric Redesign: My focus on listening to feedback and pivoting from static visuals to a mobile-first solution highlighted my agility in iterative product design.
Building for Scale: The modularity of components and the integration of psychological frameworks into engagement strategies showcase my ability to think strategically for long-term growth.
This project has undergone re-design based on the CMU Data Visualization course back in 2019.
Below is the process book for the previous ideation, research process, and reflection.