CMU OUTFITS | data visualization
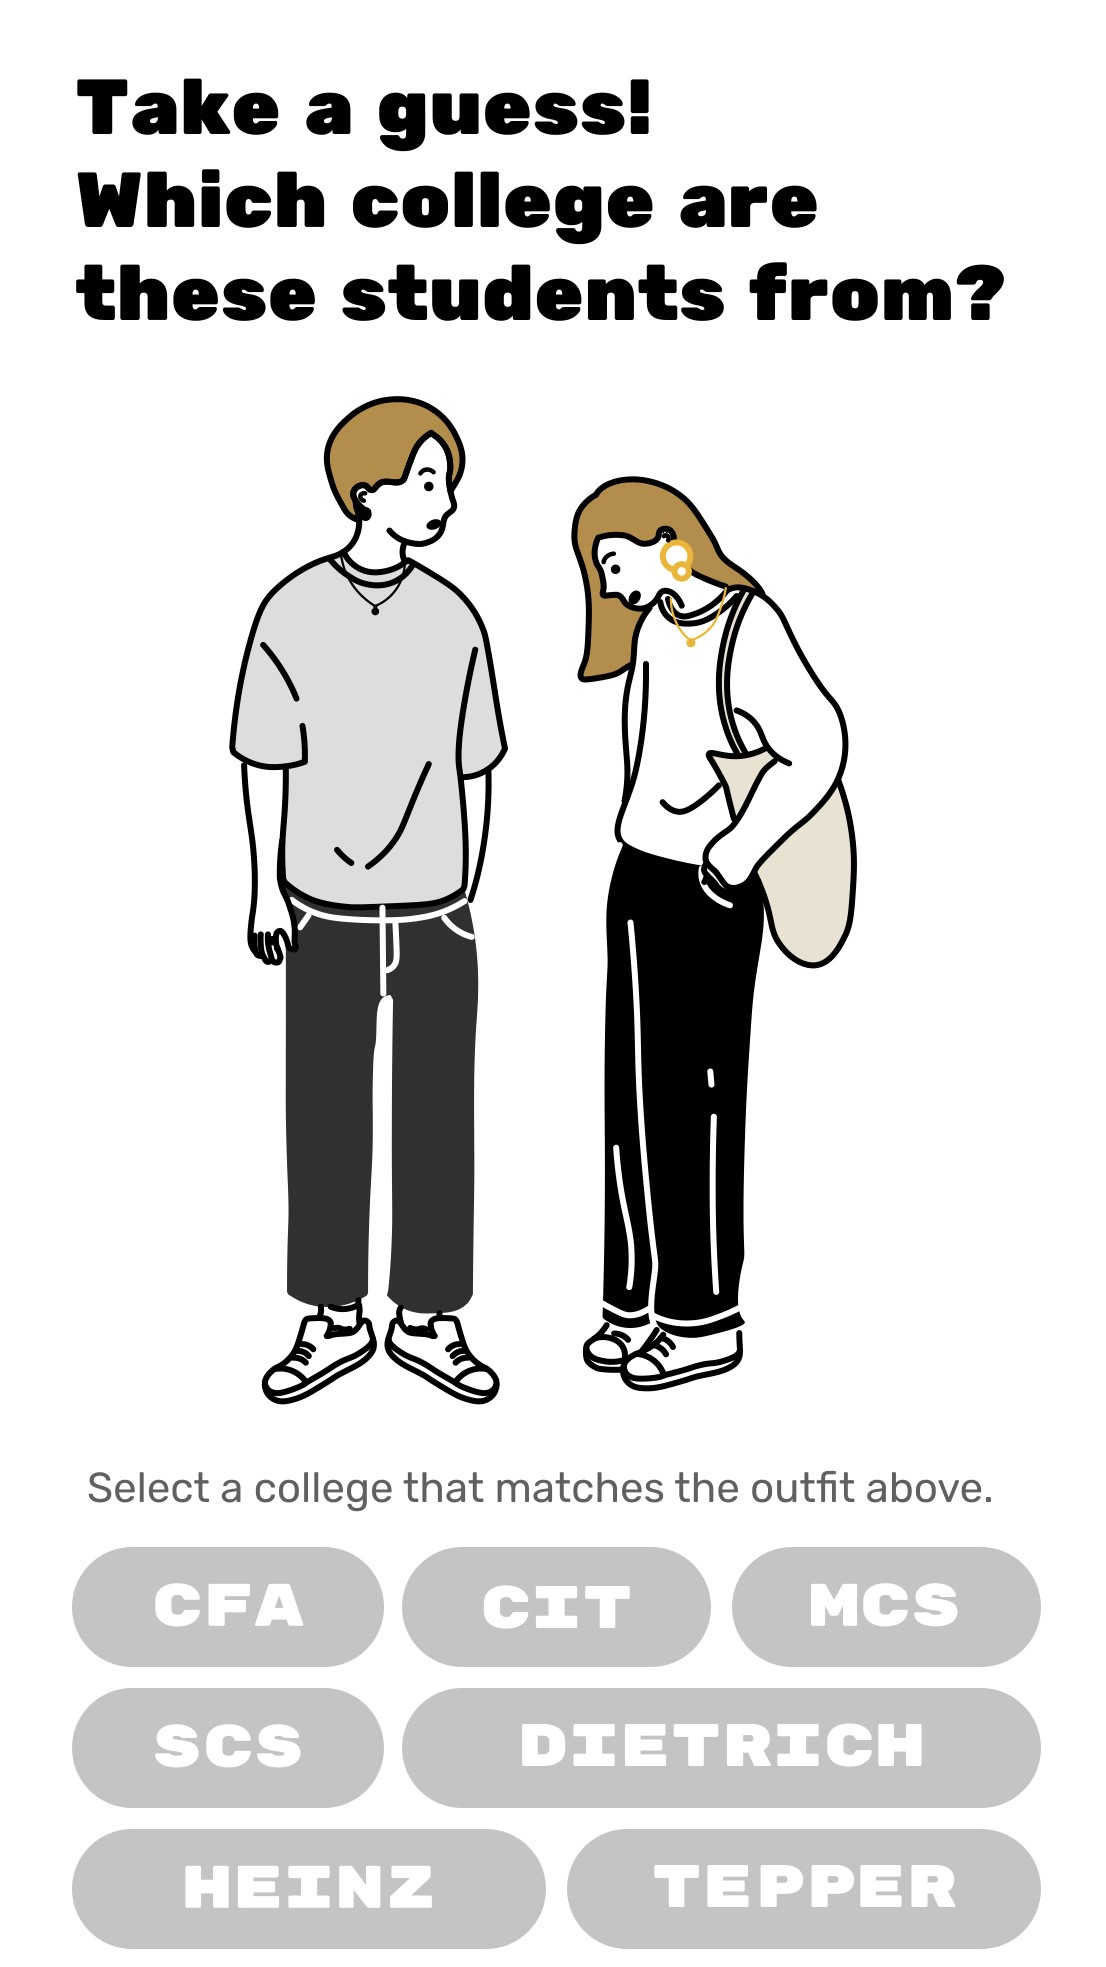
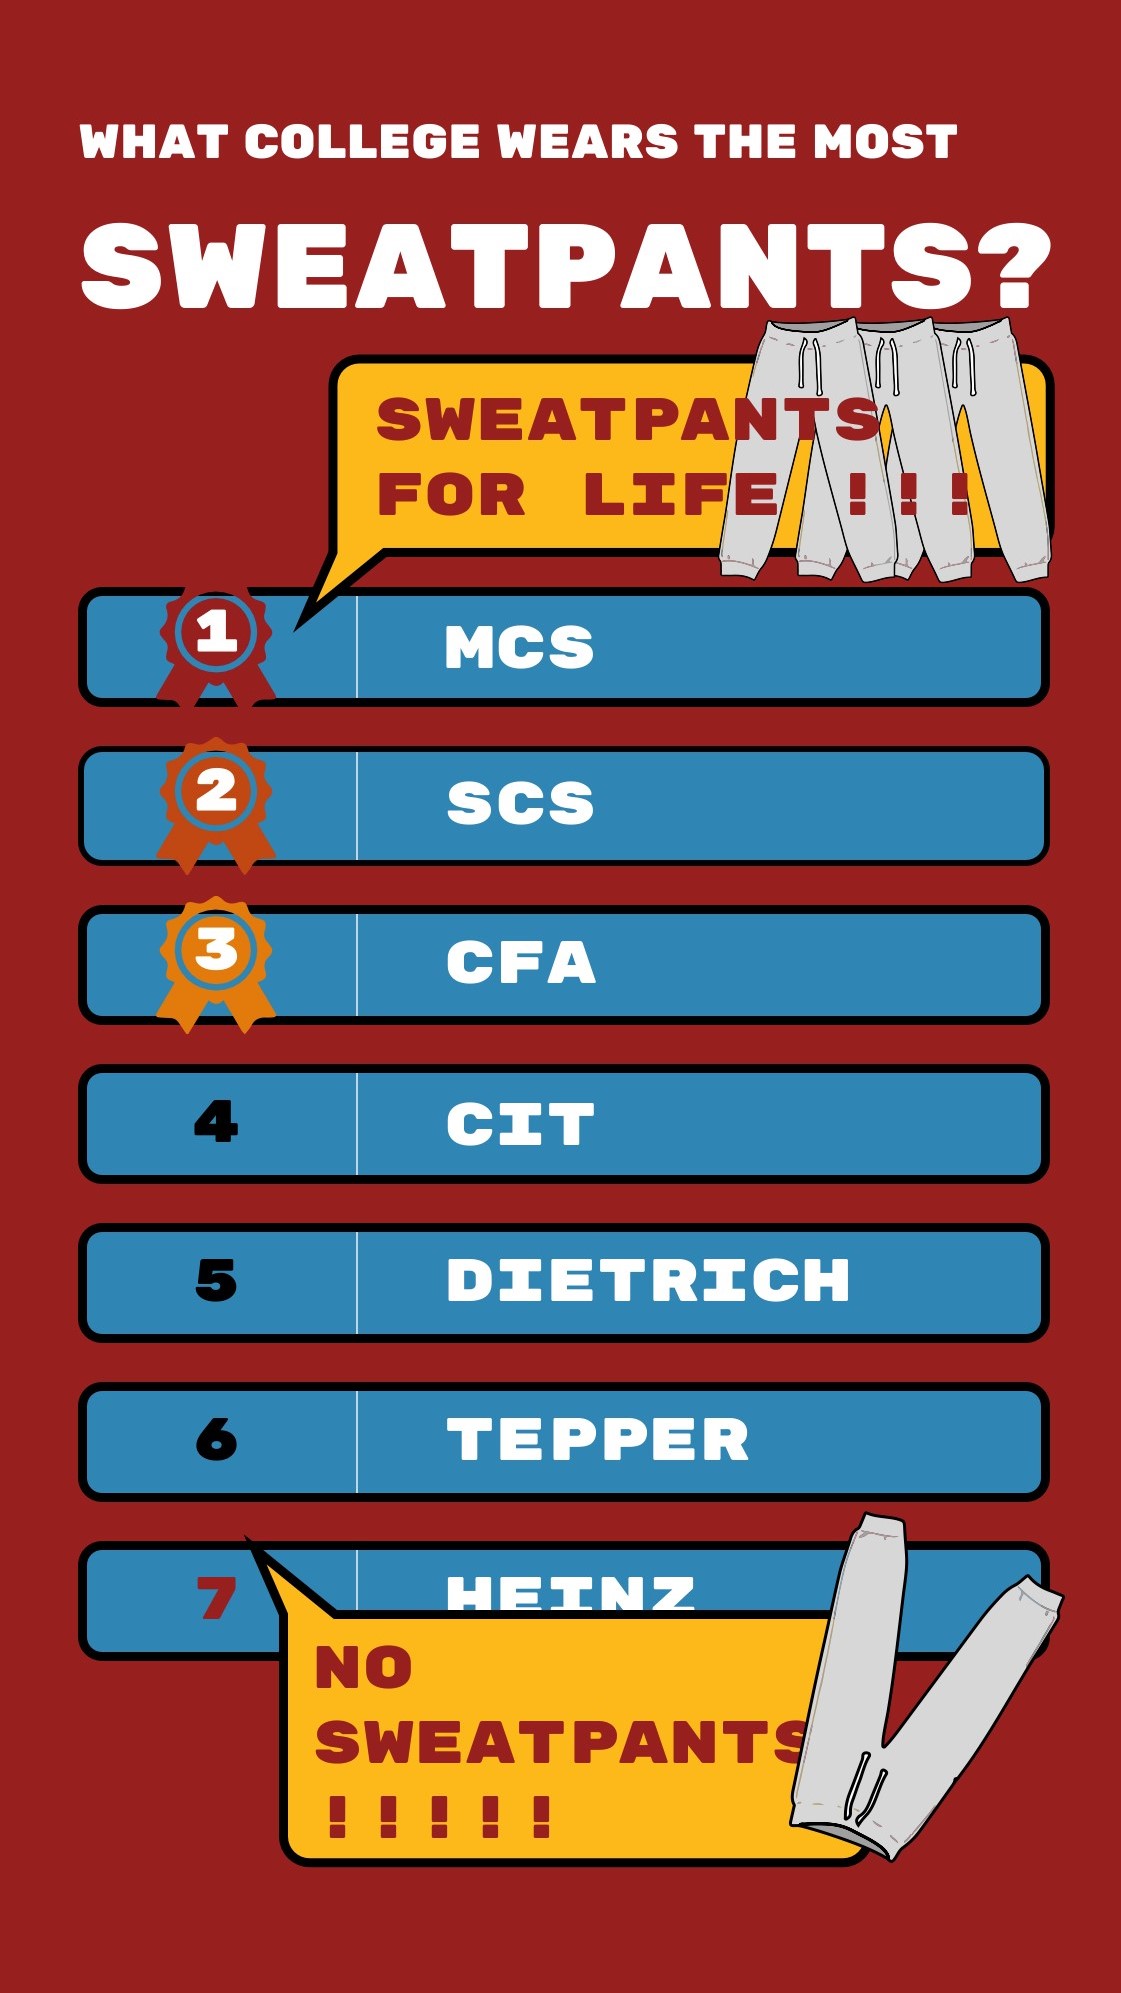
There are rumors and stereotypes about how each major's students dress in a certain style at CMU.
So, in this project, we are trying to figure out if the stereotypes are true.
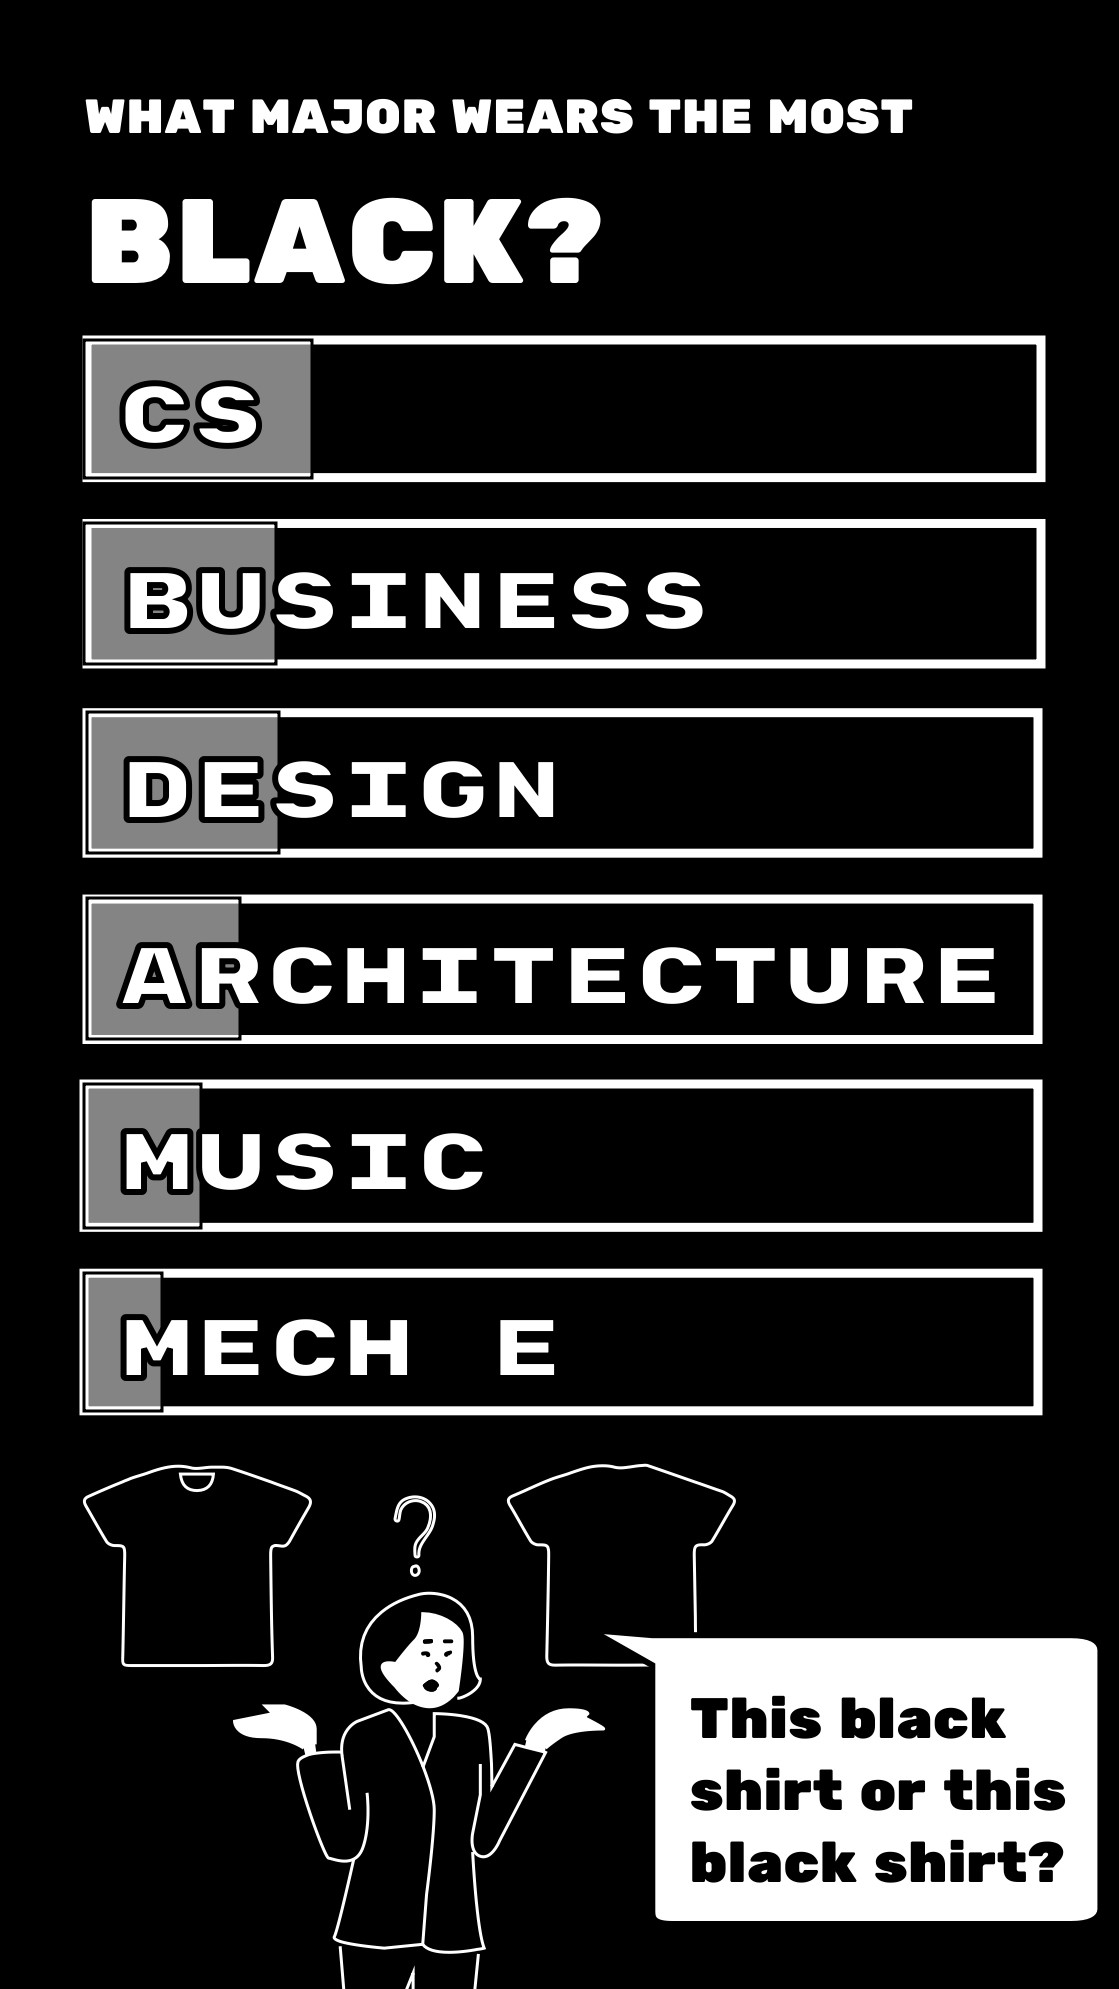
Do architectural students wear the most black?
Is there really a connection between students' majors and their outfit?
OVERVIEW
For this data visualization project, we teamed up as two to visualize the characteristics of CMU students' outfits based on their colleges and majors.
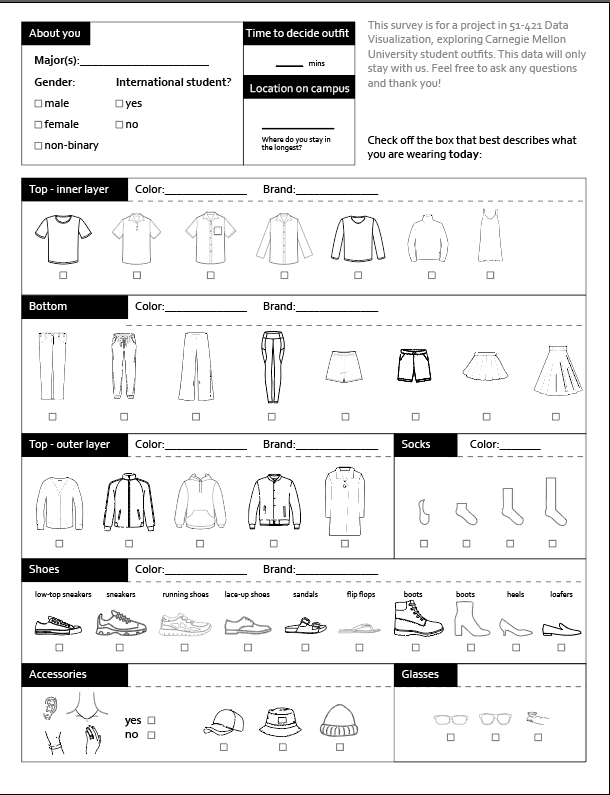
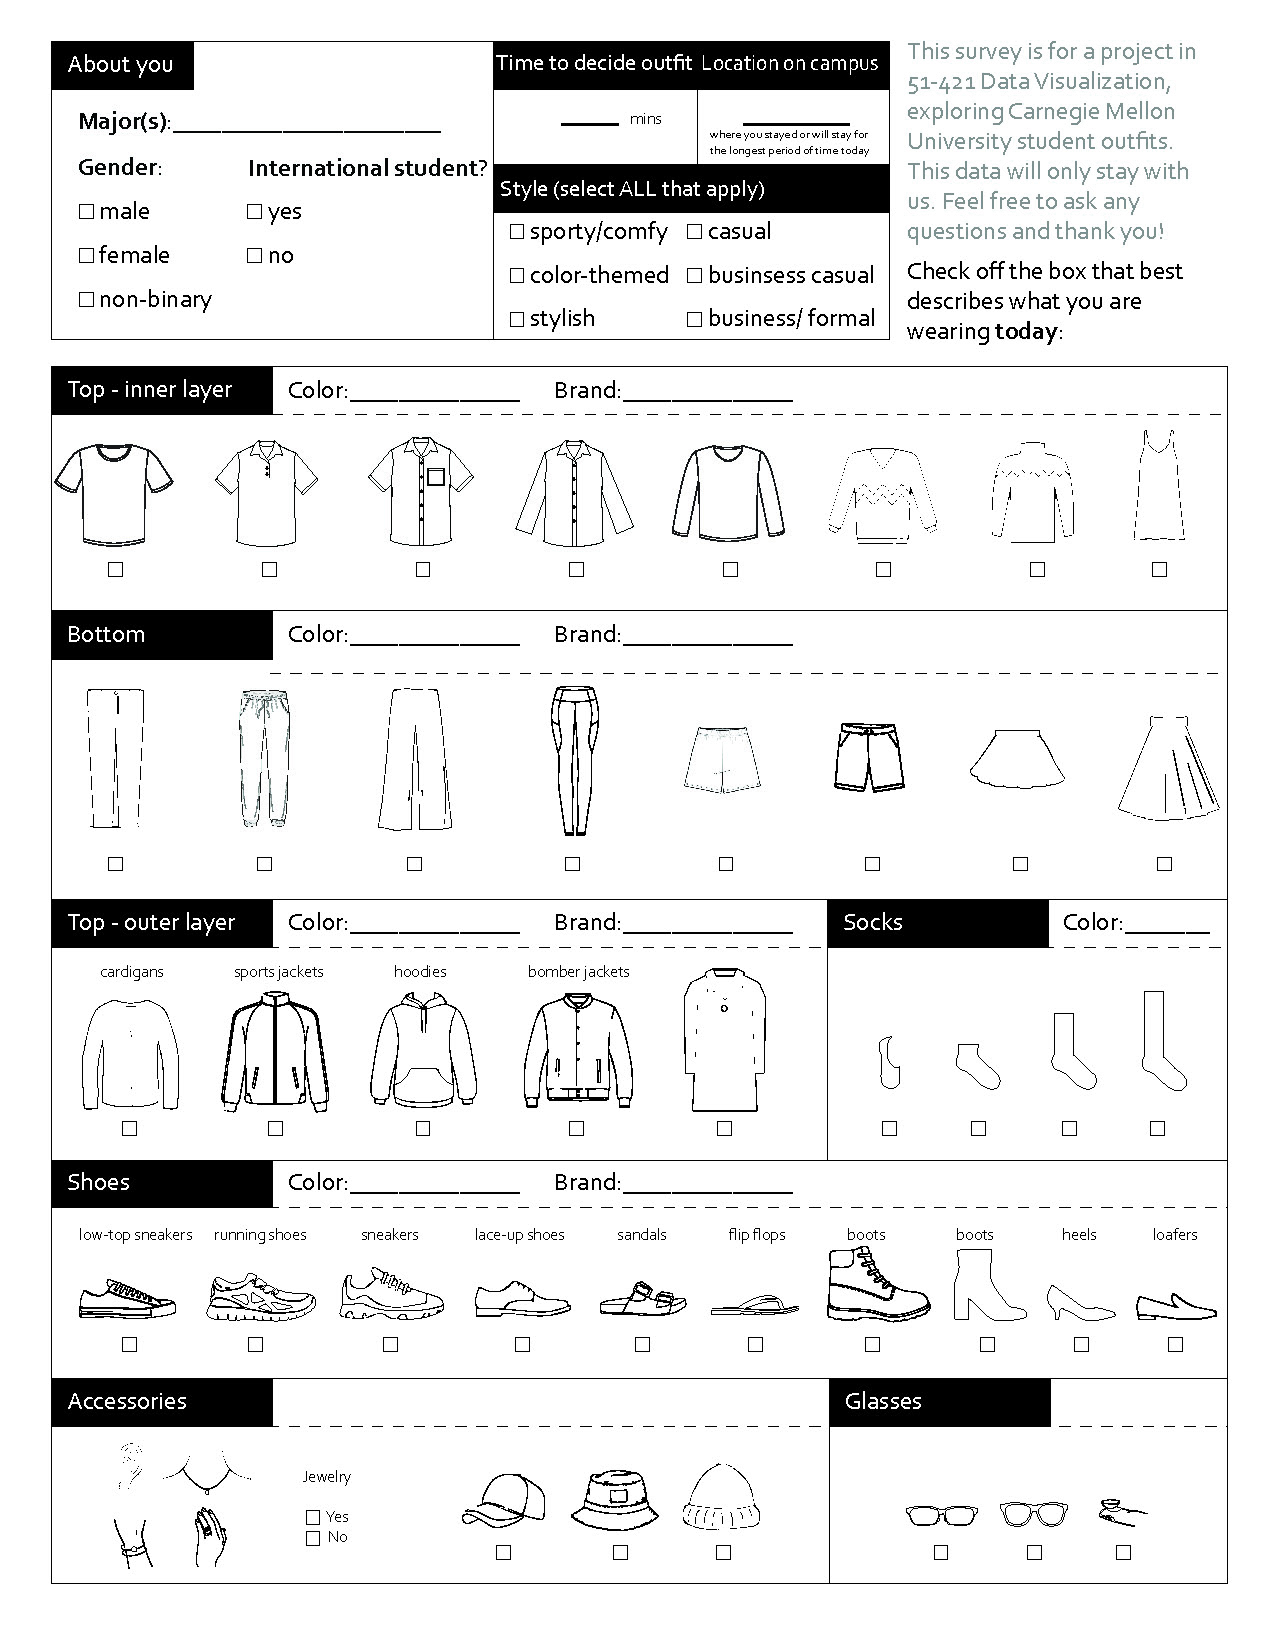
We first drafted a paper survey with questionare about choice of outfits and did a test run of the survey. Then, we revised the survey after receiving feedback.
We slipt up around the campus and gather the data through in-person survey.
After gathering the needed information, we recorded them on an Excel file. Then, with the help of Tableau, we tried to explore the patterns of the data and
ideate some initial visualization methods. Then, we started to do some basic wireframes. We first designed the wireframes on webpage and
it was hard to design visualization that would take up a widescreen. Also, with the consideration that students would rarely look at such animations/data on their laptops
because this visualization was designed to be fun and not serious, we changed the design to be focusing on mobile users only.
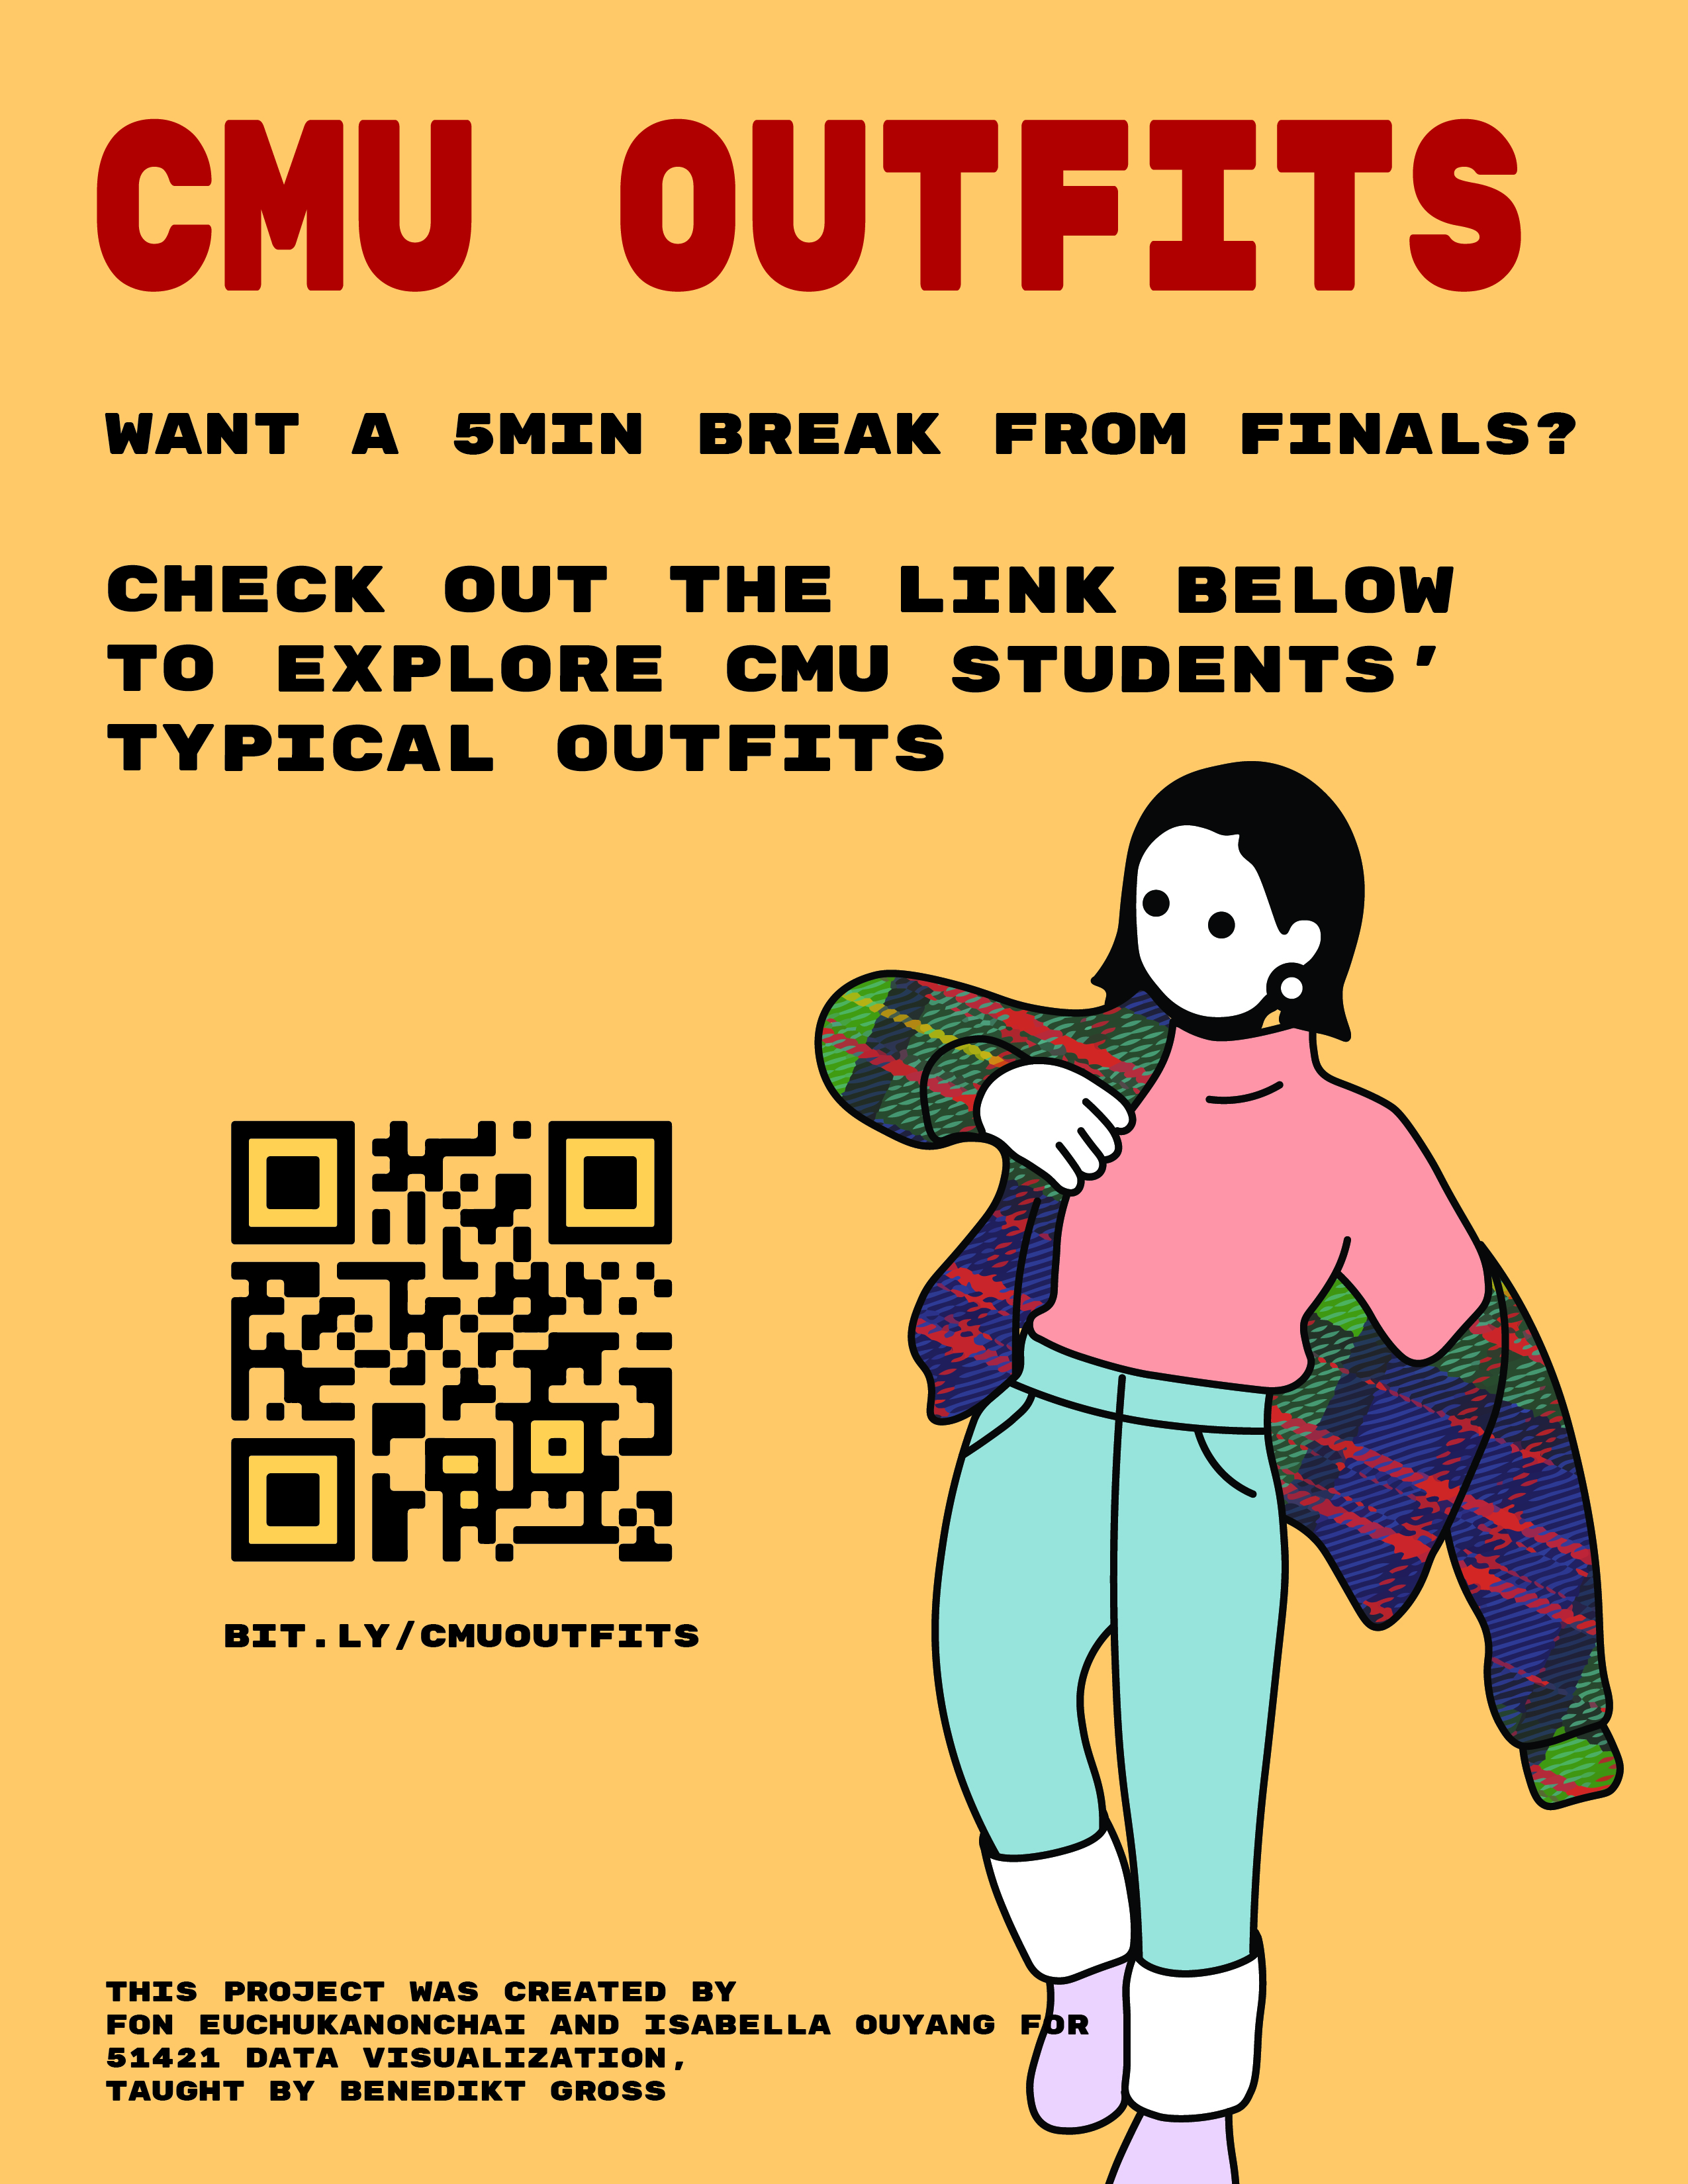
After weeks of prototyping and iteration, we published our website through hanging posters around campus and posting on social media.
At the end of the visualization, we linked a survey form aksing for some feedback on the accuracy and student's thoughts on our project.
Jump to REFLECTION here
SURVEY & PUBLICATION
WEBSITE | link
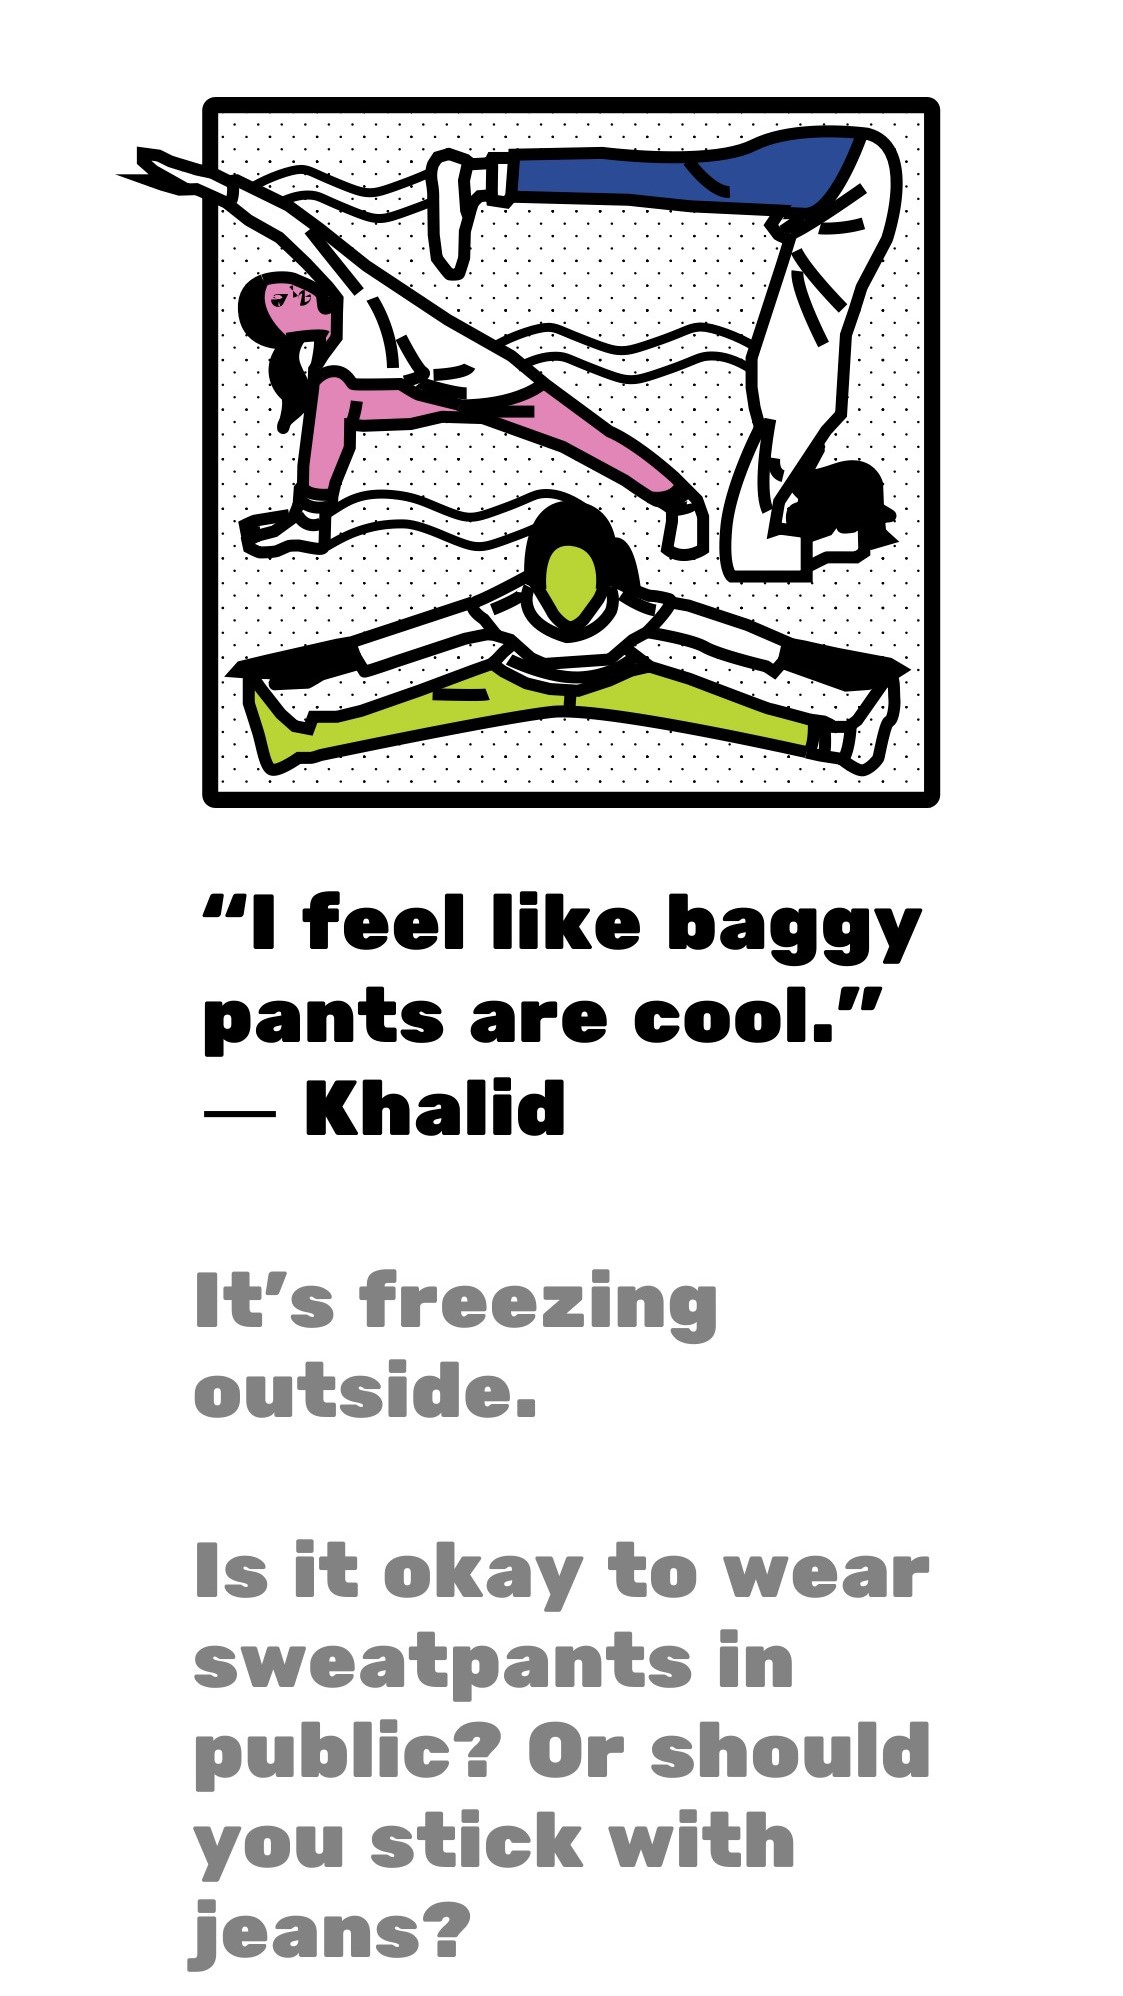
The website was hard coded on mobile screen with the consideration of students' habits.
REFLECTION
With additional time allocated for project refinement, a compelling avenue for improvement lies in expanding the scope of our survey
to include a more extensive sample of students, thus enriching the dataset and creating a more comprehensive database.
This approach could unveil clearer connections between students' accessory choices—such as belts, hats, and glasses—and their respective majors.
Additionally, exploring whether the day of the week influences students' outfit preferences could yield valuable insights.
Beyond the realm of fun and informative visualizations, I am eager to delve into the untapped potential of this dataset.
